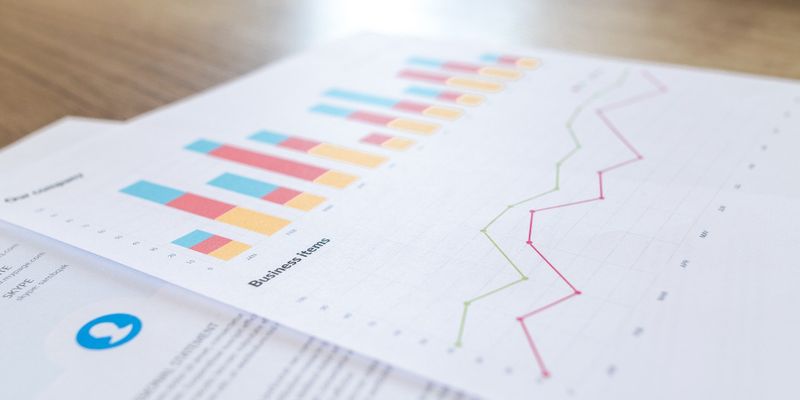
Graphs
Graphs are a visual representation of numerical and mathematical values used to display scientific data. Many types of graphs can be drawn including bar graphs, pie charts, line graphs, and dot plots.
-
NOV 05, 2025
 EVENT BROADCAST INFORMATION: Wednesday, November 5th, 2025 (Click below to add broadcast to your calendar) Europe + Nordics + Middle East + Africa: 11:00am CET | 12:00pm EET North America +...AUG 25, 2021 | 6:00 AM PDT
Labroots is excited to present the 9th annual event in the Neuroscience Virtual Event Series....MAR 11, 2020 | 6:00 AM PDT
Labroots is excited to present the 8th annual event in the Neuroscience Virtual Event Series....MAR 14, 2018 | 6:00 AM PDT
Labroots is excited to present the 6th annual event in the Neuroscience Virtual Event Series....OCT 11, 2017 | 6:00 AM PDT
The 5th Annual Event in the Cancer Research & Oncology Week Virtual Event Series is now On-Demand!...MAY 10, 2017 | 6:00 AM PDTC.E. CREDITS
The 5th Annual Event in the Genetics and Genomics Virtual Event Series is now On Demand. This event covers the most recent and exciting advances in genetics research....JAN 25, 2017 | 5:00 AM PST
The Abcam virtual exhibition is temporarily closed. It will re-open shortly. Please check back October 25th. All webinars will be available for viewing at that time.Get the su...
EVENT BROADCAST INFORMATION: Wednesday, November 5th, 2025 (Click below to add broadcast to your calendar) Europe + Nordics + Middle East + Africa: 11:00am CET | 12:00pm EET North America +...AUG 25, 2021 | 6:00 AM PDT
Labroots is excited to present the 9th annual event in the Neuroscience Virtual Event Series....MAR 11, 2020 | 6:00 AM PDT
Labroots is excited to present the 8th annual event in the Neuroscience Virtual Event Series....MAR 14, 2018 | 6:00 AM PDT
Labroots is excited to present the 6th annual event in the Neuroscience Virtual Event Series....OCT 11, 2017 | 6:00 AM PDT
The 5th Annual Event in the Cancer Research & Oncology Week Virtual Event Series is now On-Demand!...MAY 10, 2017 | 6:00 AM PDTC.E. CREDITS
The 5th Annual Event in the Genetics and Genomics Virtual Event Series is now On Demand. This event covers the most recent and exciting advances in genetics research....JAN 25, 2017 | 5:00 AM PST
The Abcam virtual exhibition is temporarily closed. It will re-open shortly. Please check back October 25th. All webinars will be available for viewing at that time.Get the su...
NOV 05, 2025
EVENT BROADCAST INFORMATION: Wednesday, November 5th, 2025 (Click below to add broadcast to your calendar) Europe + Nordics + Middle East + Africa: 11:00am CET | 12:00pm EET North America +...
AUG 25, 2021
| 6:00 AM PDT
Labroots is excited to present the 9th annual event in the Neuroscience Virtual Event Series....
MAR 11, 2020
| 6:00 AM PDT
Labroots is excited to present the 8th annual event in the Neuroscience Virtual Event Series....
MAR 14, 2018
| 6:00 AM PDT
Labroots is excited to present the 6th annual event in the Neuroscience Virtual Event Series....
OCT 11, 2017
| 6:00 AM PDT
The 5th Annual Event in the Cancer Research & Oncology Week Virtual Event Series is now On-Demand!...
MAY 10, 2017
| 6:00 AM PDT
C.E. CREDITS
The 5th Annual Event in the Genetics and Genomics Virtual Event Series is now On Demand. This event covers the most recent and exciting advances in genetics research....
JAN 25, 2017
| 5:00 AM PST

The Abcam virtual exhibition is temporarily closed. It will re-open shortly. Please check back October 25th. All webinars will be available for viewing at that time.Get the su...