Can you even imagine a world without globalization? The demand and supply of exchanging goods and resources from one corner of the world to another is our reality today. But what is that reality doing to the environment? A new paper published in Nature Ecology & Evolution is using a series of maps to convey globalization’s impacts.
"Identifying hotspots of species threat has been a successful approach for setting conservation priorities. One important challenge in conservation is that, in many hotspots, export industries continue to drive overexploitation. Conservation measures must consider not just the point of impact, but also the consumer demand that ultimately drives resource use. To understand which species threat hotspots are driven by which consumers, we have developed a new approach to link a set of biodiversity footprint accounts to the hotspots of threatened species on the IUCN Red List of Threatened Species. The result is a map connecting consumption to spatially explicit hotspots driven by production on a global scale. Locating biodiversity threat hotspots driven by consumption of goods and services can help to connect conservationists, consumers, companies and governments in order to better target conservation actions,” write Daniel Moran of the Norwegian University of Science and Technology and Keiichiro Kanemoto of Shinshu University in Japan, the researchers behind the study.
Moran and Kanemoto looked at 6,803 vulnerable, endangered, or critically endangered species around the world, identified the commodities that affect them, then traced those commodities to their final destination using a global trade model. Their maps exhibit the cumulative terrestrial and marine species-threat hot spots linked to legal exports to the United States, the European Union, China, and Japan.
The following map, taken from the study in Nature, shows global hotspots of species threat linked to consumption in the United States. Darker areas indicate areas of threat hotspots driven by US consumption, based on the mix of threats exerted in each country and the mix of export goods sent to the United States for final consumption. Terrestrial and marine species colour bars are on log scales showing units of total species-equivalents, which is the sum over all the fraction of species threats allocated to this consumer country.
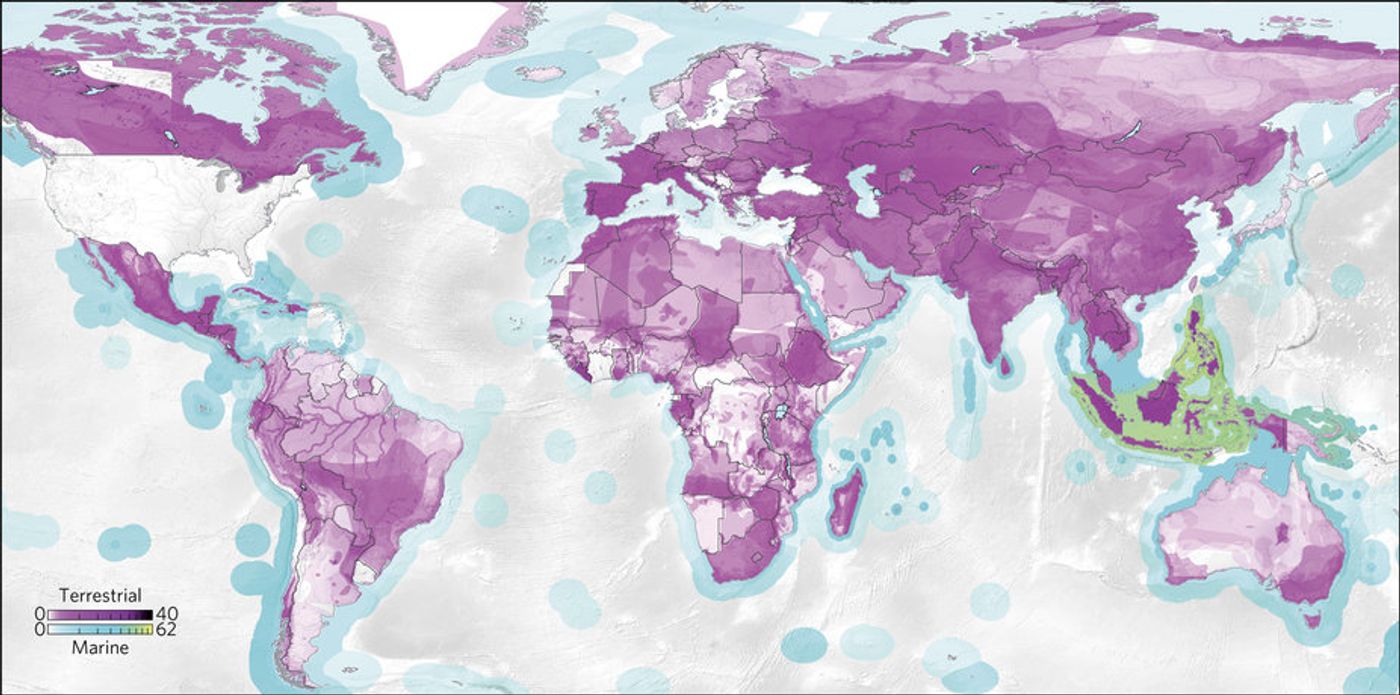
For marine species, southeast Asia is the overwhelmingly dominant global hotspot area, with the United States and European Union both exerting many threats there, primarily owing to fishing, pollution and aquaculture. The United States has additional marine hotspots off the Caribbean coast of Costa Rica and Nicaragua, and at the mouth of the Orinoco around Trinidad and Tobago. The European Union drives threat hotspots outside southeast Asia in the islands around Madagascar: Réunion, Mauritius and the Seychelles.
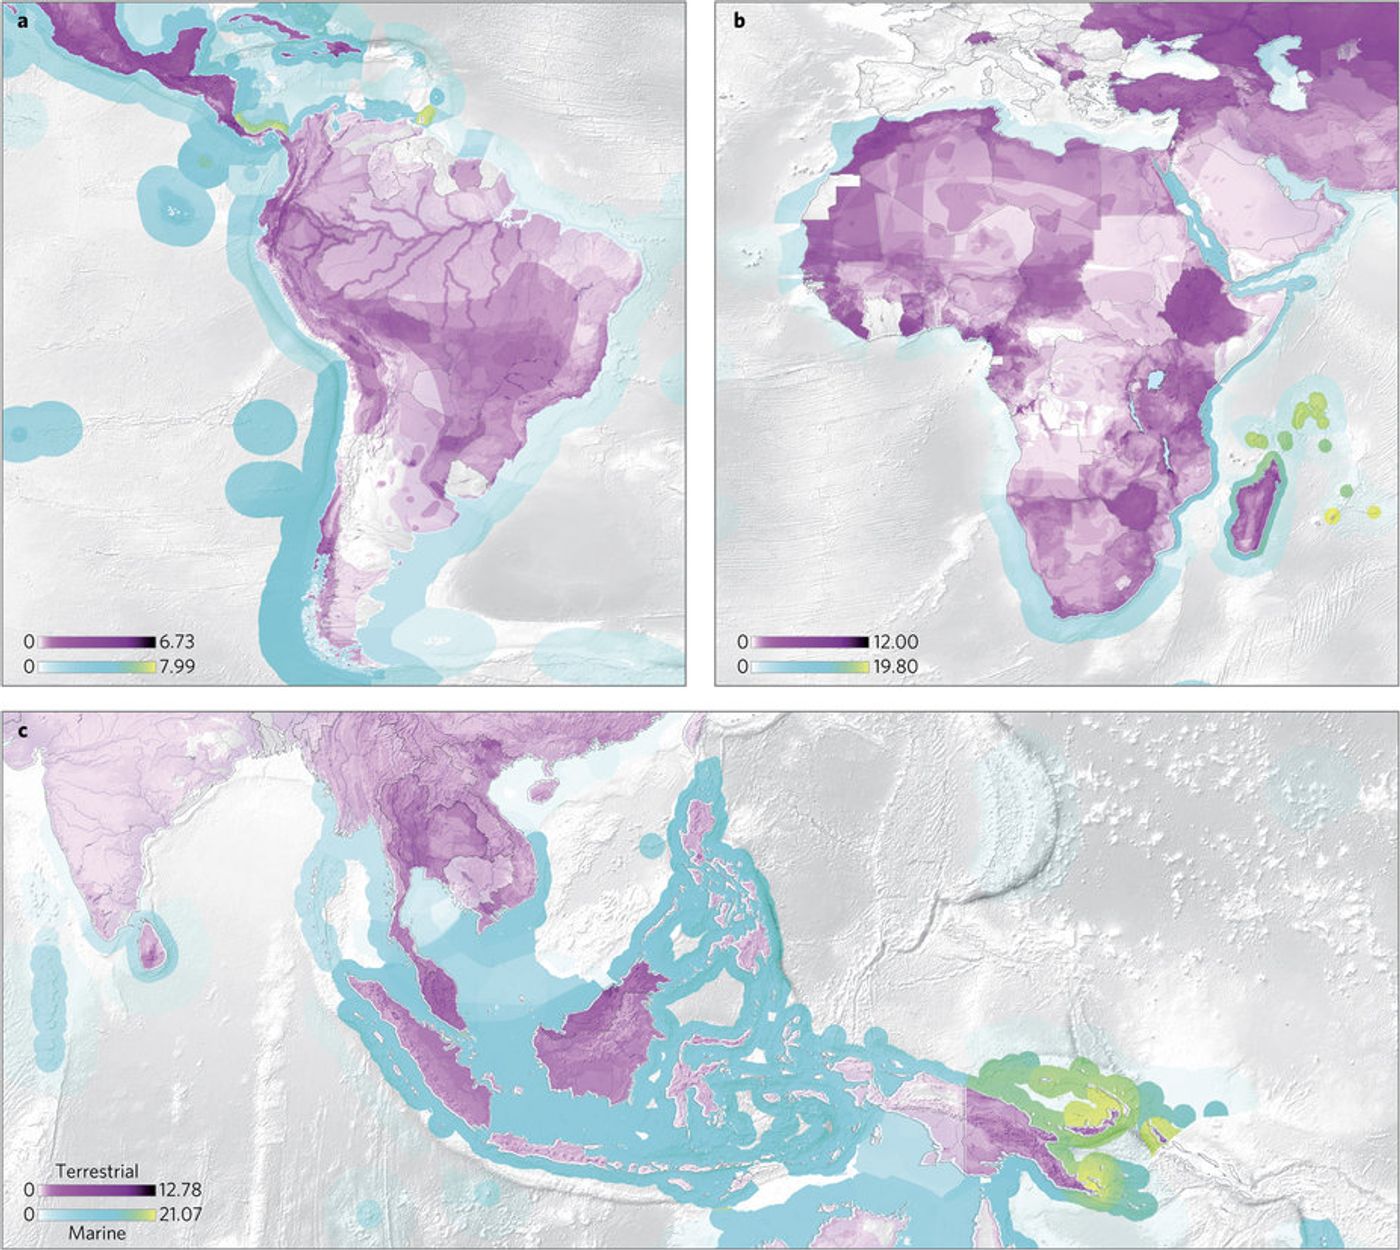
Above: Hotspots in Latin America driven by US consumption (a); in Africa driven by European (EU27) consumption (b); and in Asia driven by Japanese consumption (c). Note that some countries (including the Solomon Islands, Guyana, French Guiana, Equatorial Guinea and Western Sahara) are not covered in the economic database. Maps: Nature
Following National Geographic, the study revealed some unexpected relationships between exporting and consuming countries. For example, threats to the Amazon basin receive a fair amount of attention in the United States, but the threat from U.S. consumption in Brazil is strongest in the country’s southern highlands, where agriculture is concentrated. The U.S. map also has an unexpected threat hotspot in southern Spain and Portugal, where several fish and bird species are in trouble. The European Union’s consumption is having a big impact in Africa, particularly in countries like Ethiopia, Morocco, Zimbabwe, and Madagascar. Exports to Japan are driving threat hotspots in Southeast Asia, such as on New Britain island in Papua New Guinea, where palm oil and cocoa plantations are concentrated and a lot of logging occurs. Meanwhile, Southeast Asia’s marine species are facing threats from the U.S. and Europe.
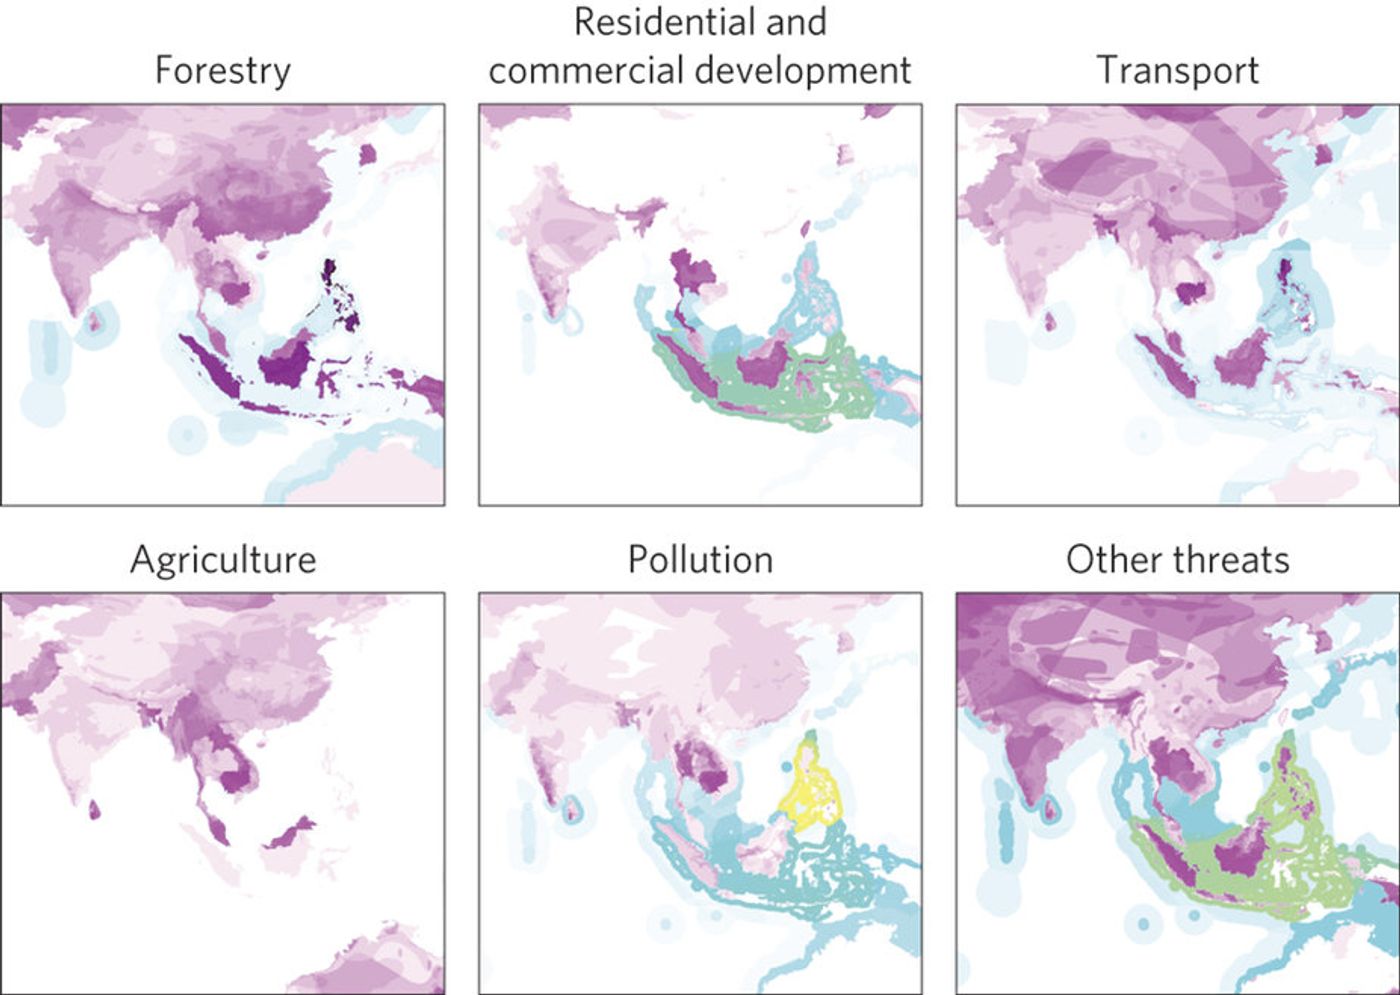
Above: Decomposition of threat hotspots linked to consumption in the United States by threat cause. Maps: Nature
The scientists determined that biodiversity footprint hotspots for a given country are a function of both underlying species richness and the composition and volume of threatening activity. Aggregated categories are based on 123 detailed threat causes, some of which are listed above to explain the US footprint by threat cause.
Moran and Kanemoto suggest that their maps can help conservationists more efficiently prioritize their work. Collaboration between the producing and consuming countries may be daunting but could be possible in some cases, especially in places where the threat is driven by exports to just two or three countries. The scientists are also hopeful that the work could help consumers interested in avoiding unsustainable products. “It is also possible to imagine companies comparing maps of biodiversity footprints against maps showing where their inputs are sourced,” they write.
Sources: Nature, National Geographic