The BLUEPRINT consortium-a high-impact European research initiative-aims to help us better understand the mechanisms of epigenomics in blood. This is done through complex functional genomics analyses using human samples from both healthy and ill people. The consortium, funded by the European Union and overseen by the International Human Epigenome Consortium (IHEC), generates and offers reference epigenomes to scientists and devises approaches for the storage and retrieval of the data, as well as enhancing the identification and analysis of epigenomic features.
Scientists and researchers from around the world participate in IHEC, with the aim of offering the high-resolution reference human epigenome maps from healthy and disease cell types in an openly available forum.
The epigenome comprises chemical compounds that attach to and modify the genome, instigating regulatory changes in the information that is "expressed." Understanding where these changes occur in the genome and how they effect this change in expression is the key focus of the effort. These changes may be transferred between cells as they multiply, and thus, can be inherited.
Key to the success of the project is being able to access, analyze, and visualize the data in a user-friendly software environment. Genomatix Software, GmbH, Munich, Germany, is one of more than 30 partners in BLUEPRINT. The company provides an integrated, web-based graphical user interface that provides easy access to the data and allows users (clinicians, biologists, students, and the general public) to combine access to the epigenomic data and annotation with both public domain and proprietary annotation in a tabular and/or visual software environment. I recently met Peter Grant, CEO of the US affiliate of Genomatix GmbH, at the annual meeting of The American Society of Human Genetics, and inquired further.
Judy O'Rourke: What makes the interface unique?
Peter Grant: Genomatix provides a unique integrated package of tabular and visual tools for use on the consortium data, which is available to the public as well as consortium members. An overview page is available for identifying/filtering existing consortium experiments. Once data sets of interest are chosen, the user can then load the data into a tabular "comparative viewer" where they can look for associations of normal/diseased areas of the epigenome with genes and include their disease, tissue, pathway, small molecule, and cancer annotation. Areas of interest chosen here can be automatically loaded in a visual genome browser in order to look at the information in its genomic context. Additionally, genes of interest can also be downloaded into a pathway/network visual application for further filtering and analysis. All these functions are provided in an integrated, seamless, easy-to-use software environment.
JO: How many samples are available in the sample overview in the current release, and do you expect this number to grow?
PG: There are currently about 350 experiments from multiple hematopoietic cell types, and the number continues to grow. We expect to have more than 600 with the next release, which is planned for January 2015.
JO: Has the Pathway/Network tool proved helpful in enabling users to see BLUEPRINT data in conjunction with ENCODE data?
PG: Within the network tool the ENCODE data is used as one source of evidence for generating gene-gene relations and can be combined with BLUEPRINT expression data there. The ENCODE data is actually much more visible in the genome browser component, where it can be overlaid with BLUEPRINT's epigenetic region data.
JO: Can you tell us which components of the interface are most used?
PG: We do not monitor the user behavior, so I'm afraid we don't have that information.
JO: Are many users building networks from scratch?
PG: Again, we're not looking at what the users do, but my guess would be that they use the "comparative view" first to filter for a few genes of interest and then start their networks from that set of genes. Of course it is possible to start a network from scratch and then expand it depending on the various lines of evidence one wants to use.
JO: What are you learning from users' mining of the site and its data?
PG: Some of the components we've developed for the BLUEPRINT interface are also used in other software provided by our company (eg, GeneGrid®), so any feedback we get in terms of usability helps us to not only improve the BLUEPRINT interface but also other tools in our portfolio. We have also learned a lot from automating the data integration part, which now enables us to import the many different types of experiments efficiently into the interface.
JO: Can you briefly update us on a key development shared at the third annual meeting of the BLUEPRINT consortium?
PG: With the August release we changed to a new technical platform for the interface. It helps by providing a better data import capabily, and the users benefit from extended filtering options and additional annotation in the comparative view. Also, the overall integration was again improved.
JO: Is there anything else you would like to add?
PG: Working together with many of Europe's leading universities and research institutes is, to say the least, an inspiring experience. Epigenomics is an important field of research within the life science community and being a part of this important effort that helps scientists explore these data is very rewarding for our company.
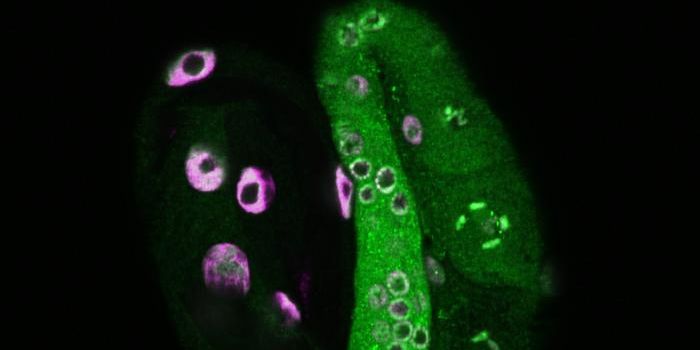
Image source: UCSF