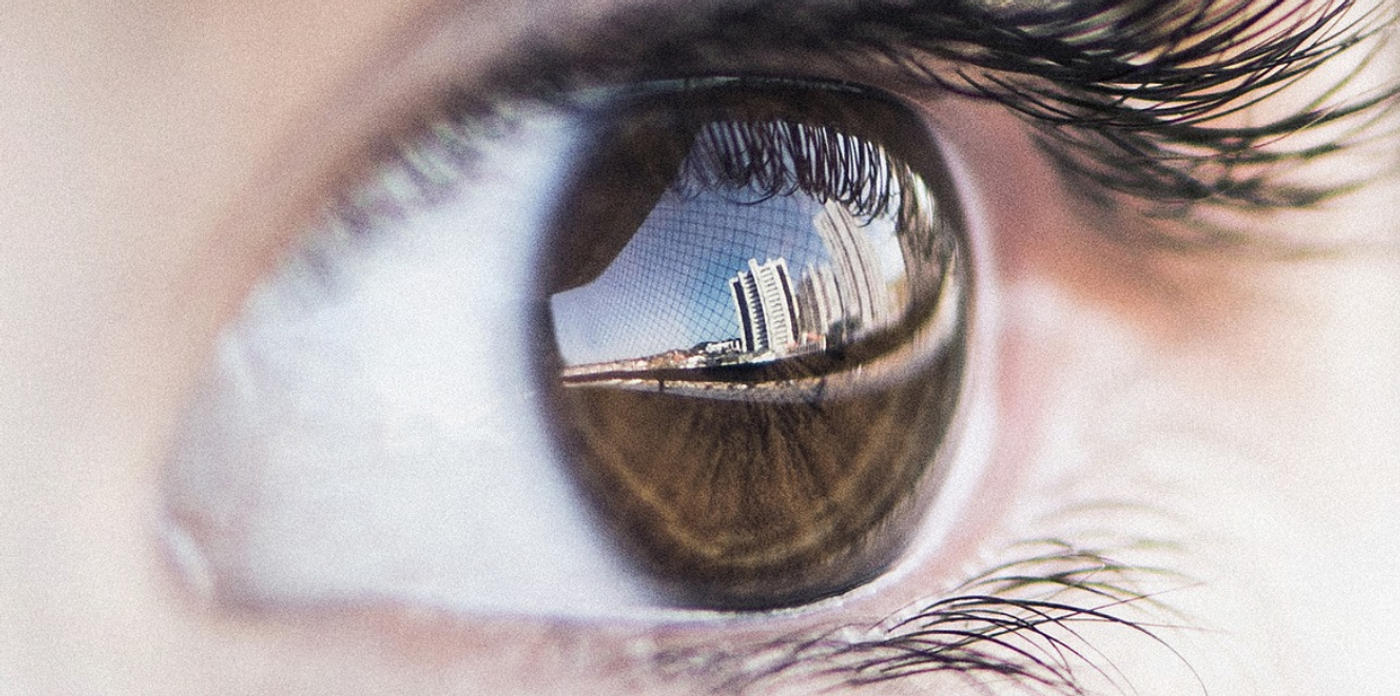
Different parts of the brain have been carefully mapped, so we have some idea of what parts of the brain are used to perceive our environment, move our bodies, or solve problems, for example. In vision, information about what we see moves through the brain. Our eyes see by assessing the images that fall on the retina; each photoreceptor can 'sample' a different part of an image. As light enters the eye and hits photoreceptors, it is converted to a signal that moves along the optic nerve to the part of the brain that processes the information. Different neurons are then activated based on various characteristics in the image, such as spatial location, light-dark contrast, or orientation, for example.
So as the number of receptors in the visual field increases, sampling density is said to increase, and more details can be visualized in that image. Those receptors send information to neurons in a receptive field, which can vary in size based on the organism; some animals have much better vision than others. Electrodes have been used to measure receptive fields in different animals, and MRI can assess them in humans.
In higher order mammals' visual cortex, the neurons form a pattern in the cortical surface. Different species are thought to generate visual maps in similar ways, arranging cortical structures around a center, like a pinwheel. This pinwheel pattern is found in many species.
Variations among animals in the sampling density of their visual space is proposed to give rise to that pattern. Sampling density has increased as animals have evolved, there are more neurons in the cerebral cortex, or receptive field, to accommodate the increase in sampling density. Larger brains have bigger cortical areas where there is a neuron for each visual point. As the receptive field of the cortex increases, the neurons are sorted into clusters where similar properties converge, such as the same point of vision, or the same polarity, whether light or dark, for example. The clusters of cortical neurons enable a huge diversity of stimuli to be absorbed from each point of vision, which creates a pinwheel pattern of stimulus orientation.
The study authors noted that for a geographical map to be accurate, a full description of a location is typically needed. The example they use is New York Public Library, which can be found in New York City, but more specifically, at the corner of 42nd street and 5th avenue, on the southwest corner. Multiple pieces of information are also needed for a good visual map.
While this study used experimental data to confirm a computational model, the researchers are confident that this theory will help us understand cortical map formation for vision and potentially other senses.
Experienced research scientist and technical expert with authorships on over 30 peer-reviewed publications, traveler to over 70 countries, published photographer and internationally-exhibited painter, volunteer trained in disaster-response, CPR and DV counseling.