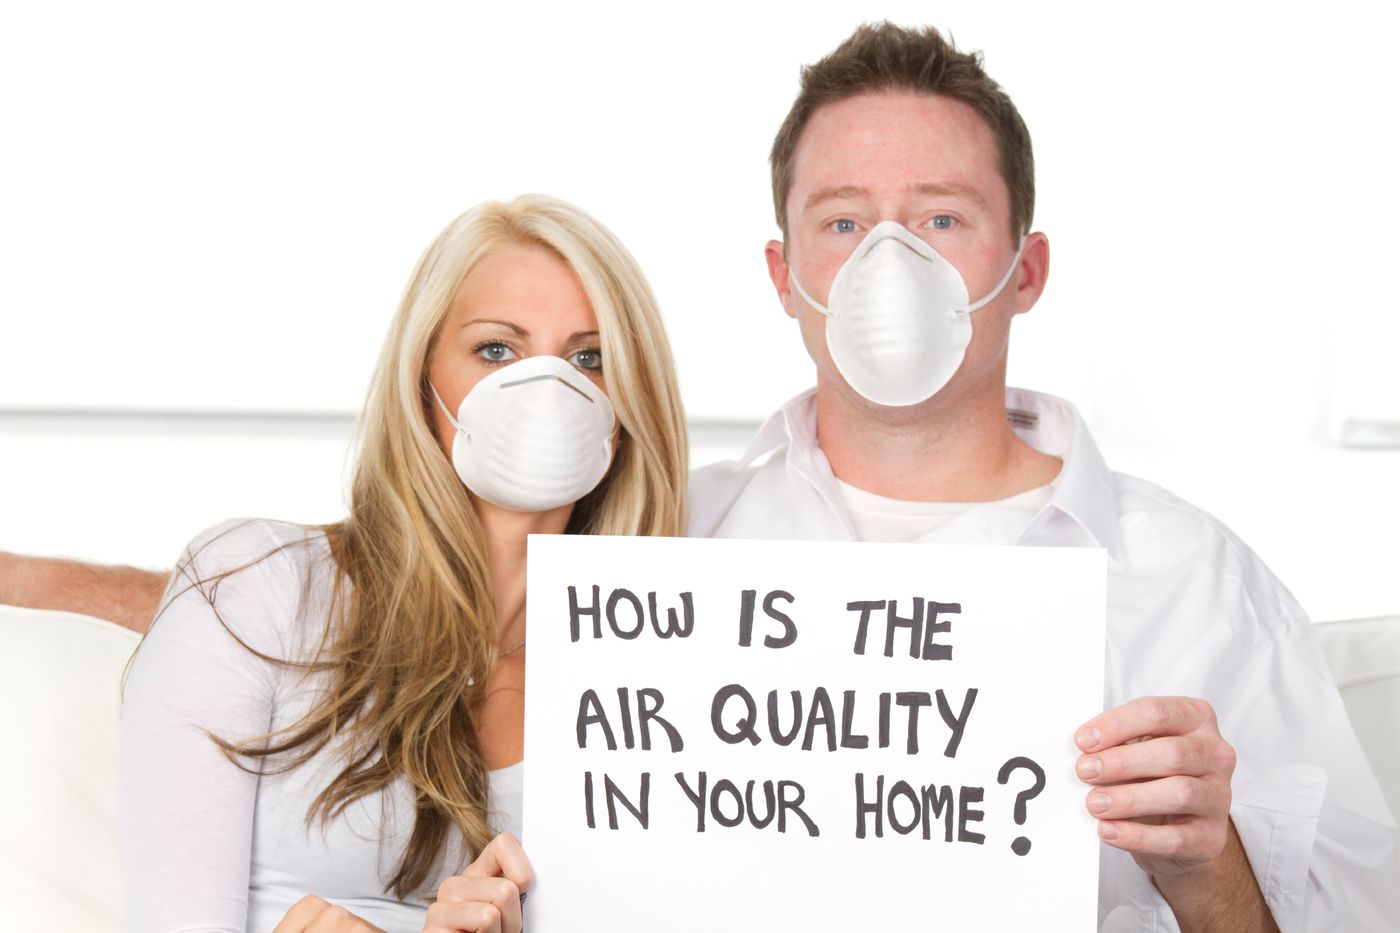
Air quality is largely invisible. But what if you could see it? I’m not talking about air pollution that’s so bad that the whole city is covered in a haze of smog. I’m talking about the air quality inside your home. That is usually harder to see, which is why we don’t think about it that much, University of Utah scientists argue. It also could be what’s holding us back from changing our habits to become healthier.
Scientists from the University of Utah's School of Computing developed a system called MAAV, which stands for Measure Air quality, Annotate data streams, and Visualize real-time PM2.5 levels. The system allows people to physically see the quality of the air they are consuming day-in and day-out.
“MAAV supports collecting data from multiple air quality monitors, annotating that data through multiple modalities, and sending text message prompts when it detects a PM2.5 spike. MAAV also features an interactive tablet interface for displaying measurement data and annotations,” write the authors.
Using MAAV, the researchers conducted a study with participants over six long-term field deployments (20-47 weeks). "The idea behind this study was to help people understand something about this invisible air quality in their home," says lead author Jason Wiese. To do so, three air quality monitors were placed in each participant’s home, two in high-traffic areas of the house like the kitchen or bathroom and one outside or close to the porch.
“Each minute, each sensor automatically measured the air for PM 2.5 (a measurement of tiny particles or droplets in the air that are 2.5 microns or less in width) and sent the data to the server,” explains Science Daily. “The data could then be viewed by the homeowner on an Amazon tablet that displayed the air pollution measurements in each room as a line graph over a 24-hour period. Participants in the study could see up to 30 days of air pollution data. To help identify when there might be spikes in the air pollution, homeowners were given a voice-activated Google Home speaker so they could tell the server to label a particular moment in time when the air quality was being measured, such as when a person was cooking or vacuuming. Participants also were sent an SMS text message warning them whenever the indoor air quality changed rapidly.”
The study showed various conclusions in regards to what activities caused a spike in air pollution levels in a particular home. Interestingly, the circumstances that made the air pollution worse were unique to each home; cooking and vacuuming, for example, had different impacts on different homes.
One conclusion was very clear, though: if homeowners are able to visualize the air quality in their home, they are much more likely to be involved in analyzing the data of their habits and changing their ways to become healthier.
The study was published in the Proceedings of the ACM on Interactive, Mobile, Wearable and Ubiquitous Technologies.
Sources: Science Daily, Proceedings of the ACM on Interactive, Mobile, Wearable and Ubiquitous Technologies