As you might imagine, measuring glaciers is difficult – those hulking masses of ice don’t easily fit on a yardstick. But understanding how glaciers change and morph is critical to learning more about the patterns of our planet. Traditionally, scientists have measured glaciers either from aerial or satellite photographs, or by literally placing stakes in the snow. Neither technique is ideal.
But a new technology is now in play: overlapping high-resolution satellite images that can be used to create maps of the ice sheets. The idea comes from University of Washington's David Shean.
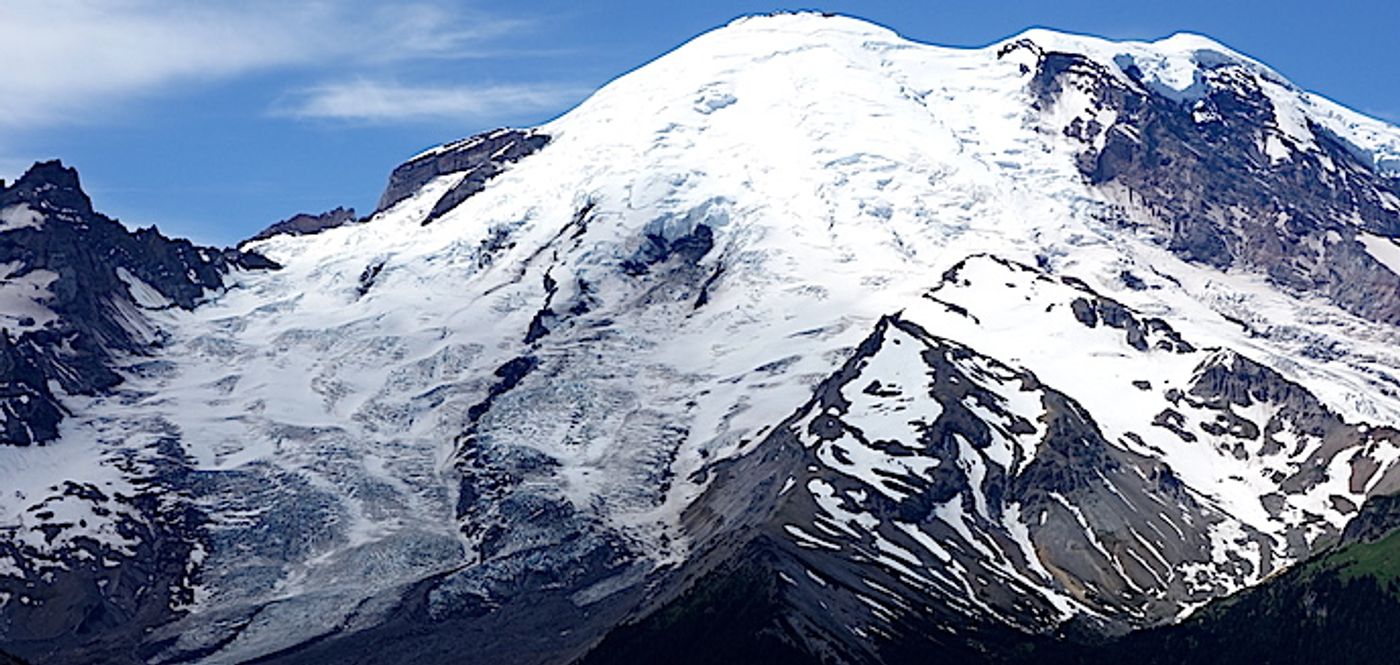
Since 2012, Shean has been collecting data on glaciers in the western United States with a satellite. A camera on the satellite takes two pictures of a specific glacier, each from a different angle. Using a computer system that pieces together the pixels of the two images and uses the differences to create a 3-D model of the surface, Shean is able to make maps that track elevation changes for the glaciers. He’s already made maps of some of the biggest glaciers in the West, including that of Mount St. Helens and Mount Rainier.
So what’s the point behind the maps?
"I'm interested in the broad picture: What is the state of all of the glaciers, and how has that changed over the last 50 years? How has that changed over the last 10 years? And at this point, how are they changing every year?" said Shean.
The maps might just be able to answer those questions. Because the data is so particular, the maps allow scientists a close look at almost 1,200 glaciers in the US, twice a year. They can also act as a tool to either confirm or deny other methods of measuring glacial changes. For instance, via a map made of the South Cascade Glacier, scientists could confirm stake measurements that highlighted glacial loss over the past 60 years. The same trend follows for the Mount Rainier Glacier. In fact, Shean estimates Mount Ranier has seen 0.7 cubic kilometers of cumulative ice loss since 1970. Though that number may not sound like a lot, it’s equivalent to removing a layer of ice about 25 feet thick all over the mountain.
Mount Rainier isn’t the only glacier suffering; using this new method, scientists can now tell that the trend spreads across the U.S. and even globally. The hope is that the more we track and understand glacial changes, the better we can determine the causes of cumulative ice loss.
But the applications of this technology are not only for the future. "The next step is to integrate our observations with glacier and climate models and say: Based on what we know now, where are these systems headed?" Shean said. "We want to know what the glaciers are doing and how their mass is changing, but it's important to remember that the meltwater is going somewhere. It ends up in rivers, it ends up in reservoirs, it ends up downstream in the ocean. So, there are very real applications for water resource management," he continues said. "If we know how much snow falls on Mount Rainier every winter, and when and how much ice melts every summer, that can inform water resource managers' decisions."
Sources: Science Daily, University of Washington