The history of life on Earth can be visualized as a branched tree. Some of those branches have spawned more growth, while others have died. The history of species and their relationships can now be visualized with a tool called OneZoom, which is freely available at onezoom.org. There, the links between 2.2 million species have been laid out on a web page, which can be explored. The site also includes images of about 85,000 species, and information about how vulnerable some of those species are to extinction. OneZoom has also been outlined in a paper in Methods in Ecology and Evolution. The study authors called this effort “the Google Earth of biology.”
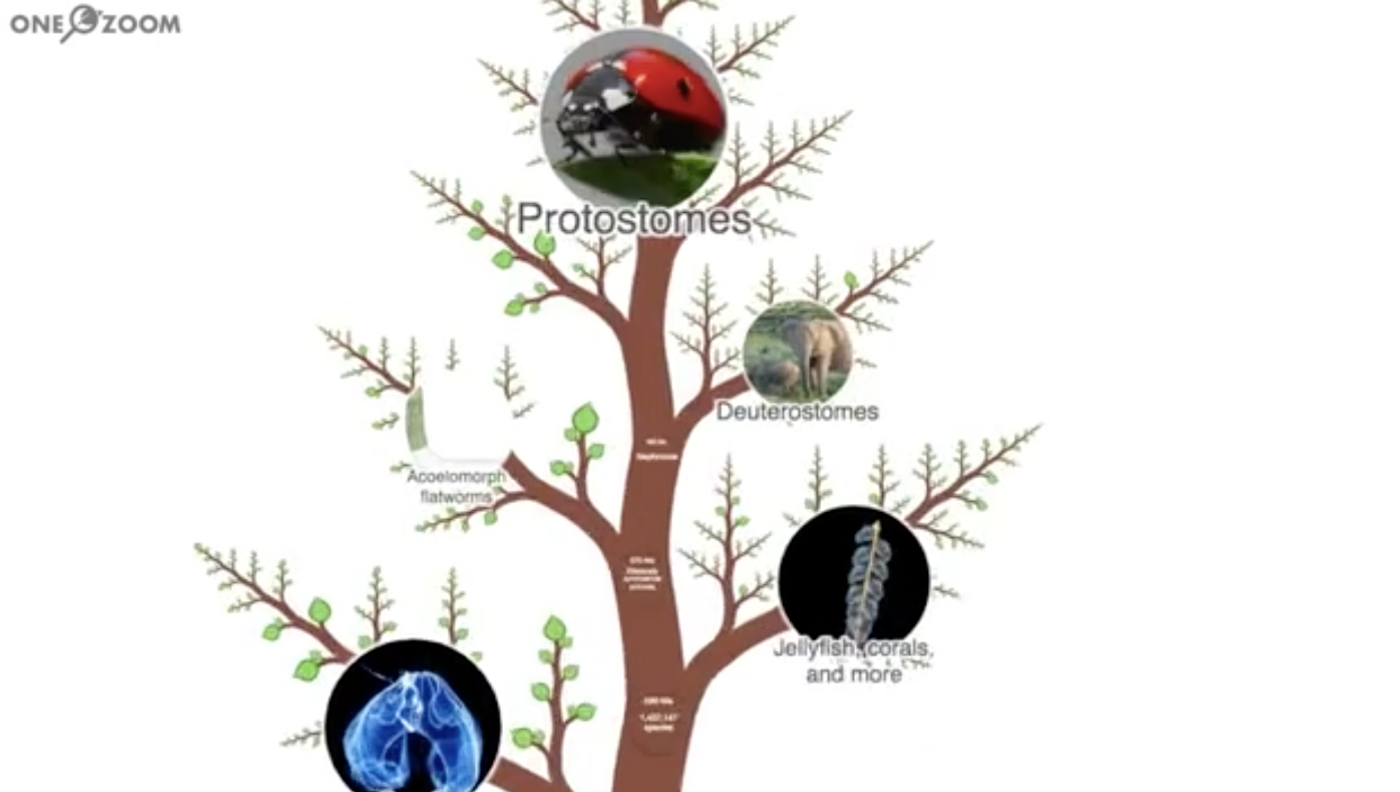
Species are represented by 'leaves' on the tree, and they're color-coded according to their extinction status. If a species status is not known, the leaf is grey. We do not known whether most species are at risk of extinction. But if there is data showing an animal is not threatened, its leaf is green, while red represents threatened and black signifies recently extinct.
“By developing new algorithms for visualization and data processing, and combining them with big data gathered from multiple sources, we’ve created something beautiful. It allows people to find their favorite living things, be they golden moles or giant sequoias, and see how evolutionary history connects them together to create a giant tree of all life on Earth," said study co-author Dr. Yan Wong, an evolutionary biologist at the University of Oxford .
The researchers aimed to make this technology easy to use so anyone can explore the species of Earth, and the challenges that many now face. The researchers “hope to send a powerful message that much of our biodiversity is under threat," said study co-author Dr. James Rosindell of the Department of Life Sciences at Imperial.
They also configured this data to work with touchscreens so it could be used more easily in places like classrooms and museums. They're hopeful that it will allow institutions to bring more information to visitors.
“Two million species can feel like a number too big to visualize, and no museum or zoo can hold all of them! But our tool can help represent all Earth’s species and allow visitors to connect with their plight,” noted Rosindell.
The scientists also integrated data from Wikipedia regarding how many times a page for a species has been viewed. “Perhaps unsurprisingly, humans come out on top, but it has swapped places a few times with the second most popular: the grey wolf - the ‘species’ that includes all domestic dogs,” said Wong.
Popular plants include cannabis, potatoes, and coconut, while salmon and trout are among other popular species of animals.
Experienced research scientist and technical expert with authorships on over 30 peer-reviewed publications, traveler to over 70 countries, published photographer and internationally-exhibited painter, volunteer trained in disaster-response, CPR and DV counseling.