What’s the story behind DNA melting temperature analysis?
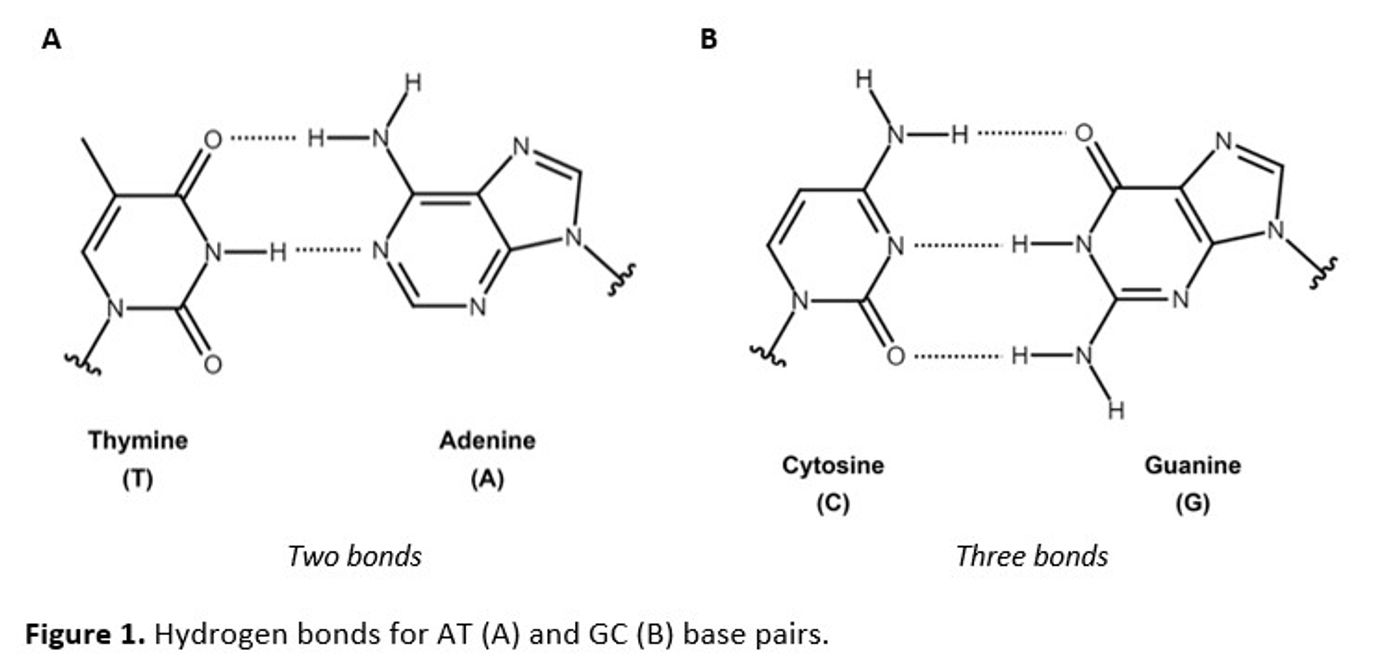
UV-Visible absorption spectroscopy can be used to assess the characteristics of deoxyribonucleic acid (DNA), a naturally occurring polymer with nucleic acid “base” subunits that connect through a phosphate sugar backbone to create single-stranded DNA (ssDNA) or combine into double-stranded DNA (dsDNA). The Watson-Crick base pairs of thymine and adenine (TA) and cytosine and guanine (CG) contain two and three hydrogen bonds (Figure 1A and 1B) that define the double helix.
The π → π* transitions in the aromatic purines (A and G) and pyrimidines (T and C) contribute to the UV absorbance peak in DNA at 260 nm (A260). In the helical structure, hydrogen bonds weaken the transitions, resulting in a smaller extinction coefficient (ε). By Beer’s law, where A = clε (A: measured absorbance; c: concentration; l: path length), this smaller ε manifests as a lower absorbance for dsDNA than for ssDNA.
What is DNA melting temperature?
Energy, in the form of heat, is needed to break the hydrogen bonds between strands (Figure 2A), overcome the activation energy (Ea), and thermodynamically favor ssDNA over dsDNA. Therefore, by monitoring the changes in A260 as a function of temperature, dsDNA dissociation into its ssDNA components becomes measurable. The temperature at which half of the dsDNA dissociates into its ssDNA parts is known as melting temperature (Tm). This unique characteristic can be determined by measuring A260 with a Thermo Scientific™ Evolution™ One Plus UV-Visible Spectrophotometer equipped with a Peltier temperature controller and calculated by Thermo Scientific™ Insight™ Pro Software.
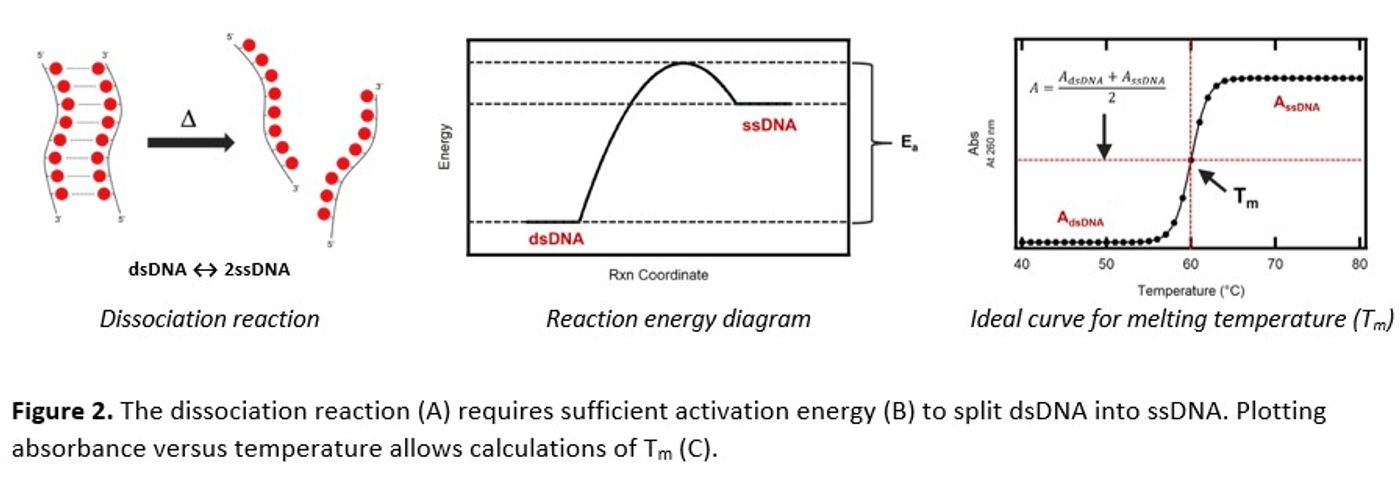
Determining the Tm of an ideal system (Figure 2C) uses a “horizontal-intercept” analysis method where the dsDNA and ssDNA temperature regions are fit to two separate linear functions independent of the melting temperature and where the point of intersection is the Tm. With more complex samples, “slope-intercept” (y=mx+b) and first-derivative “inflection” analysis methods may provide better fits. The Insight™ Pro Software helps streamline and simplify this task.
Figure 3. Thermo Scientific Evolution Spectrophotometers
How does the DNA sequence affect Tm?
DNA serves as a template for creating materials for pharmaceutical applications like gene therapy, vaccine development, and others. For the material to perform as intended, the sequence is essential, requiring analysis and confirmation of composition. Tm is sensitive to various sequence-specific factors. For example, GC pairs have a higher Tm because they require more energy (higher temperature) than AT pairs. Other influences on Tm include non-traditional secondary structures, stabilization interactions provided by nearest neighbor bases, and mutations that result in no pairing between bases (mismatches).
Sensitivity to deviations from the anticipated sequence makes Tm analysis a useful process check. Experiments in our hands (Application Note 56369) demonstrate how introducing base-pair mismatches and environmental effects, like intercalating a fluorescent dye or changing the salt concentration, can shift the calculated Tm. For example, we compared the Tm of three 40 base-pair DNA structures having zero, three, and six base-pair mismatches. Because each mismatched region has fewer hydrogen bonds than in each base-paired region, the energy needed to form stable ssDNA in solution decreased, resulting in a Tm that lowers as the number of mismatches increases.
What influence does the solvent environment have?
We also observed that the Tm of a DNA sequence can be sensitive to changes in the buffer concentration, species present in the solution, and components that can bind to DNA as well.
For example, when a dye like SYBR® Green binds to the minor groove of dsDNA, it produces a fluorescence signal that measurably disappears after denaturation. Therefore, fluorescence spectroscopy can also be used to monitor DNA melting. A caveat of this method is a comparatively higher Tm owing to the higher energy needed to break the interactions between the dye and dsDNA in addition to that needed for denaturation afterward into ssDNA. Hence, the UV-Vis method, which relies only on DNA, provides a better calculation.
Salts and buffer components also can provide backbone stabilization and increase Tm. For example, positive ions (like Na+) in solution can associate with the negatively charged phosphates of the DNA backbone. Therefore, it is vital to understand the solvent environment and keep it consistent when comparing melting curves among samples.
Better understand your DNA
Determining the melting temperature of dsDNA can help analyze its composition and structure by identifying sequence irregularities like base-pair mismatches to better your understanding of the environmental effects. UV-visible absorption spectroscopy allows the determination of this property by non-destructive means, allowing further analysis of the same samples. The Evolution UV-Visible Spectrophotometers and Peltier temperature controller can perform these measurements easily. Aided by Insight Pro Software, calculating the melting temperature seems effortless and minimizes the data work-up needed post-collection.
Learn more in our on-demand webinar: DNA Melting Temperature Analysis using UV-Vis Spectroscopy.